
So now you are the proud owner of a brand new piece of cloth for which you paid a fortune.
This article is about how you get the most out of this expensive piece of cloth and equipment
The values in this example are for an Effect and are from
http://parapente.para2000.free.fr/wings/index.html
which is a source for Paragliding wing performance figures.
It all revolves around the polar data of a wing.
A polar is a curve that shows what sink you got at what speed.
Here is an example of a polar for a wing.
A wing got a stall speed. That is the slowest it can fly. Any slower
than this and , well, you plummet out the sky.
In this example the minimum speed is at 22 km/h and there
we got 1.7 m/s sink.
The polar also shows you your best minimum sink. If you ridge soar or
thermal you try to fly around best sink.
To climb as quickly as possible. Minimum sink is 1.15 m/s at
30 km/h in this example.
As you fly faster you got more sink.
The next point of interest on a polar is the best glide point.
Where you get the furthest. It is the tangent to the polar through
the 0,0 origin of the axis system.
Best glide 1.29 m/s at 35 km/h.
Another point of interest for a Paraglider is Trim speed 1.31
at 36 km/h.
Which can not be seen offhand in the polar.
It is your maximum speed without any speedbar applied, toggles up.
The polar ends in the maximum speed at 50 km/h. and 2.9 m/s sink.
That's how far whoever tested the wing could accelerate the wing.
And the polar helps us to determine certain values like
1.4 m/s at 38 km/h
1.6 m/s at 40 km/h
2.2 m/s at 45 km/h
If you want to determine your glide ratio, or glide angle, at a certain
speed of your glider ,
find you speed on the x axis, go down where it intersects the
polar, make a dot , draw a line from the dot to the origin 0,0.
The line that has the best glide , is closest to the x axis, is that
green line in the picture.
So how much influence has the wind and the sink got on you getting as far as possible?
And how much speedbar should one apply to fly optimal in sinking air?
This tables gives you the speed to fly in relation to various sink and wind speeds.
Negative wind is from the front, slowing you down.
Ratio is the glide ratio of your wing
Speed is the airspeed of your wing, to get your
ground (GPS) speed , add the wind speed to it
| Wind
Speed |
+0.0 | -1.0 | -2.0 | -3.0 | -4.0 | -5.0 | ||||||||||||
|---|---|---|---|---|---|---|---|---|---|---|---|---|---|---|---|---|---|---|
| Ratio | Speed | Sink | Ratio | Speed | Sink | Ratio | Speed | Sink | Ratio | Speed | Sink | Ratio | Speed | Sink | Ratio | Speed | Sink | |
| -30 | 02.0 | 46. | -2.3 | 01.4 | 50. | -2.9 | 01.1 | 50. | -2.9 | 00.9 | 50. | -2.9 | 00.8 | 50. | -2.9 | 00.7 | 50. | -2.9 |
| -20 | 03.5 | 39. | -1.5 | 02.2 | 44. | -2.0 | 01.7 | 49. | -2.7 | 01.4 | 50. | -2.9 | 01.2 | 50. | -2.9 | 01.1 | 50. | -2.9 |
| -10 | 05.5 | 36. | -1.3 | 03.2 | 40. | -1.6 | 02.4 | 43. | -1.9 | 01.9 | 47. | -2.4 | 01.6 | 50. | -2.9 | 01.4 | 50. | -2.9 |
| +00 | 07.7 | 34. | -1.2 | 04.3 | 37. | -1.4 | 03.1 | 40. | -1.6 | 02.4 | 43. | -1.9 | 02.0 | 46. | -2.3 | 01.8 | 48. | -2.6 |
| +10 | 10.0 | 33. | -1.2 | 05.5 | 36. | -1.3 | 03.9 | 38. | -1.4 | 03.0 | 41. | -1.7 | 02.5 | 43. | -1.9 | 02.1 | 45. | -2.1 |
| +20 | 12.4 | 33. | -1.2 | 06.8 | 35. | -1.3 | 04.7 | 37. | -1.4 | 03.6 | 39. | -1.5 | 03.0 | 41. | -1.7 | 02.5 | 43. | -1.9 |
| +30 | 14.8 | 32. | -1.2 | 08.0 | 34. | -1.2 | 05.5 | 36. | -1.3 | 04.3 | 37. | -1.4 | 03.5 | 39. | -1.5 | 03.0 | 41. | -1.7 |
An Effect has a trim speed around 37. On a typical day, with some wind from the back in some average sink with you toggles up you fly optimal.
No need for any extreme pushing of the speedbar.
Only if you have hardly any wind from the back and get into serious sink, then apply a bit of speedbar.
Flying into wind is a killer. You will get nowhere the moment you have
headwind.
| Wind
Speed |
+0.0 | -1.0 | -2.0 | -3.0 | -4.0 | -5.0 | ||||||||||||
|---|---|---|---|---|---|---|---|---|---|---|---|---|---|---|---|---|---|---|
| Ratio | Speed | Sink | Ratio | Speed | Sink | Ratio | Speed | Sink | Ratio | Speed | Sink | Ratio | Speed | Sink | Ratio | Speed | Sink | |
| -30 | 03.1 | 54. | -2.2 | 02.2 | 60. | -2.8 | 01.7 | 60. | -2.8 | 01.4 | 60. | -2.8 | 01.2 | 60. | -2.8 | 01.1 | 60. | -2.8 |
| -20 | 04.6 | 45. | -1.5 | 03.0 | 55. | -2.3 | 02.3 | 60. | -2.8 | 01.9 | 60. | -2.8 | 01.6 | 60. | -2.8 | 01.4 | 60. | -2.8 |
| -10 | 06.7 | 40. | -1.2 | 03.9 | 48. | -1.7 | 02.9 | 55. | -2.3 | 02.4 | 60. | -2.8 | 02.1 | 60. | -2.8 | 01.8 | 60. | -2.8 |
| +00 | 09.0 | 37. | -1.1 | 05.0 | 44. | -1.4 | 03.6 | 50. | -1.8 | 02.9 | 56. | -2.4 | 02.5 | 60. | -2.8 | 02.1 | 60. | -2.8 |
| +10 | 11.5 | 35. | -1.1 | 06.2 | 41. | -1.3 | 04.4 | 46. | -1.6 | 03.4 | 51. | -1.9 | 02.9 | 56. | -2.4 | 02.5 | 60. | -2.8 |
| +20 | 14.1 | 34. | -1.1 | 07.4 | 39. | -1.2 | 05.2 | 44. | -1.4 | 04.0 | 48. | -1.7 | 03.3 | 52. | -2.0 | 02.9 | 56. | -2.4 |
| +30 | 16.8 | 33. | -1.0 | 08.7 | 37. | -1.1 | 06.0 | 41. | -1.3 | 04.6 | 45. | -1.5 | 03.8 | 49. | -1.8 | 03.3 | 53. | -2.1 |
Lets compare an Effect with a Boomerang 2 on a day with 20 km/h or 5.71 m/s from the back in 2 m/s sink.
The Effect should fly 37 km/h or 10.27 m/s, and the Boomerang 2 44 km/h or 12.2 m/s to have an optimal glide.
Both start off at cloud base, 1 km above ground, and leave at the same time, at the same altitude
And both of them fly optimal from a glide angle point.
Both are sinking with 2 m/s + 1.4 m/s = 3.4 m/s
Effect 10.27+5.71 = 15.98 or 16/3.4 = 4.7 glide ratio as the table shows
B 2 12.2 + 5.71 = 17.91 or 17.91/3.4 = 5.25
In every second the B2 gains 2 m.
After 200 seconds both wings have lost 680m and time to look for a thermal.
Effect has covered 3.2 km and B2 has 3.6 km
If you have the JAVA runtime installed and a JAVA enabled browser
then open in a new Window the interactive
Polar Java Applet
The Speed to fly theory says, that one has to add the expected average thermal strenght to the sink rate in the table.
If you expect an average 2 m/s thermal in front of you, and you are
in 1 m/s sink, then add 1 + 2 = 3 m/s and look in the table for 3 m/s how
fast you have to fly.
But you fly best if you apply an honest average of the next thermal.
And an honest average includes seek time, centering time, coring it,
and until it fizzles out and you still hang in those last 0.5 m/s
I reckon your true average of a good day is somewhere between 1-2 m/s.
Based on Reichmann, Streckensegelflug.
How far can one get on a good day ?
Lets assume you expect a 20 km/h wind pushing you.
And an average 2 m/s thermal climb rate for the day.
For the Effect in the table, look up 20 km/h and 2m/s and it gives us 37 km/h and -1.4 m/s.
The average ground speed will then be AGS = ((expected climb)/ ( expected climb - glider sink)) * (ground speed)
AGS = (2/(2 - -1.4)) * (37+20) = (2/3.4) * 57 = 30.8 km/h
Assuming you got 5 hours flying time available with those conditions.
If all goes well then one can fly 5 hours * 30.8 km/h =
154 km with an Effect.
For the Boomerang 2 we find 44 km/h and -1.4 m/s in the table.
AGS = (2/3.4) * 64 = 37.6 km/h , in 5 hours = 188
km.
Here is a screengrab of the Speed to Fly , Best Glide, component.
This example assumes a 20km/h wind from the back , and an average
expected climb of 1.9 m/s for the next thermal.
In calm air we would now have to fly the Effect with 39km/h and the
Boomerang 2 at 46 km/h to fly optimal to the next thermal.
And our average ground speed for the day would be 15+20 = 35 km/h for
the Effect and 20+20 = 40 km/h for the Boomerang.
April 2006. A slow no wind day in De Aar. I manage to fly on my Arcus 4-30 78km in 4hours 30 minutes.
OLC gives me an average of 16.7 km. A fellow pilot afterwards reckons with a hotter glider I would have done 100km.
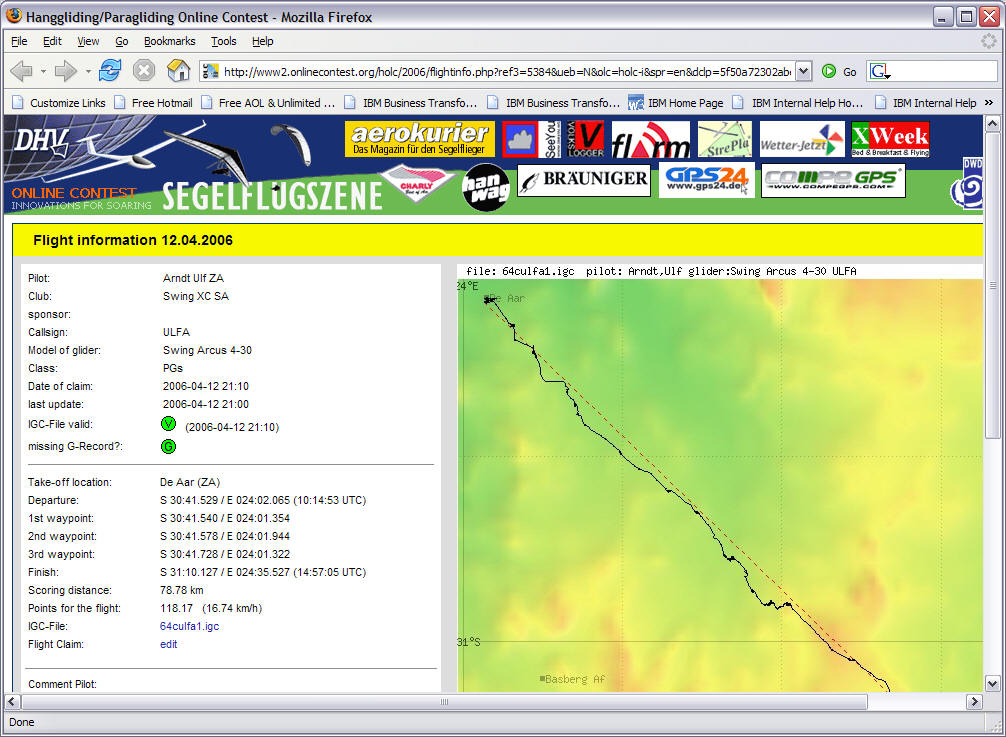
Let's check this out with the speed 2 fly applet.
I choose a Boomer 4 and compare it with the Arcus 4.
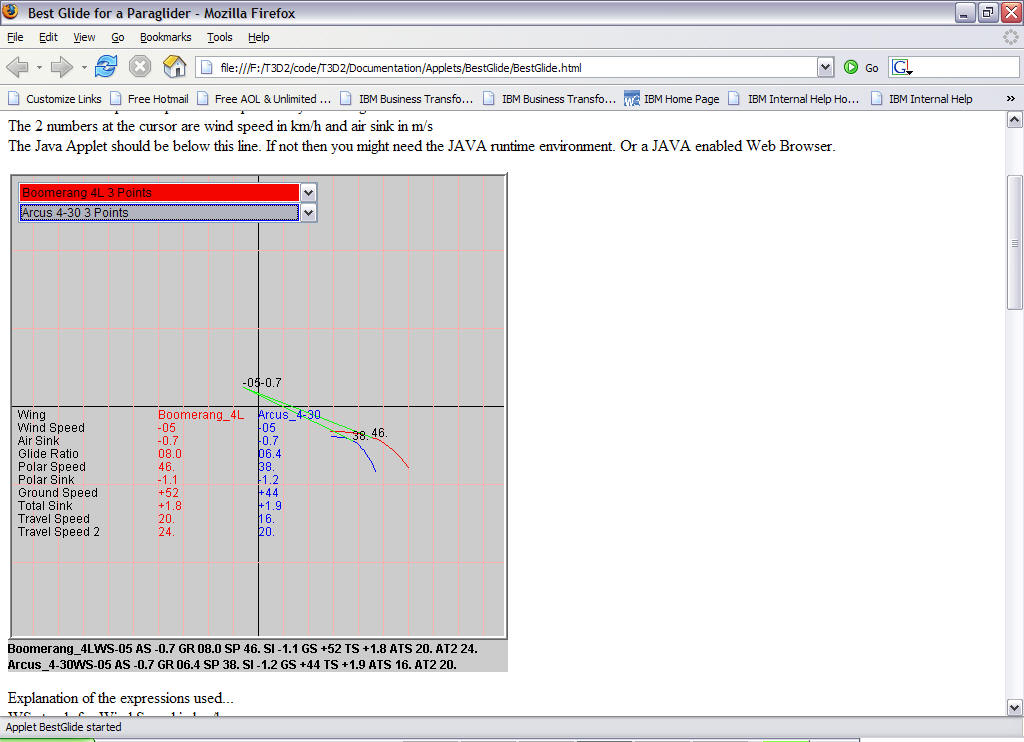
Then move the mouse to show in travel speed 16 for the Arcus. I get 20 km/h for the Boomer.
With my flying style, if I had flown a Boomer 4 on that day I would have gone 20* 4.5 = 90 km far.
Based on SSSA ( Soaring Society of SA) seminar
Highest temperature can be expected between 15.00 and 17.00 in
a day.
Thermals start off in the day narrow and strong and become wide
and weak in the late afternoon
Thermals tend to weaken when getting close to cloudbase. Sailplanes
leave thermal when it gets weaker.
With PG I have to calculate it through if we can make it to the
next lift.
When high fly fast, when low reduce speed. With a PG we have
not got much of a speed difference to play with.
SSSA statistics on the chance of finding a thermal of a certain strenght
when leaving cloudbase.
| Thermal probability | 1.5 km | 8 km | 15 km |
| 0.5 m/s | 20% | 90% | 99% |
| 1.0 m/s | 10% | 60% | 84% |
| 2.0 m/s | 5% | 30% | 52%
|
| 3.0 m/s | 2% | 10% | 18% |
Assuming for a PG a 1 in 8 , 1000m AGL, we can apply the 8km column.
If one is prepared to accept a 0.5 m/s thermal then one got a
90 percent chance to find one.
If one messes around finding the core of a strong thermal , then the average climb is reduced drastically.
Another rule of thumb is that one needs 2.5 times the height of a thermal
to find another one.
And if you go through some turbulence, search a bit in case there is
some lift close by.
The best climb under a cloud can be expected, according to SSSA seminar,
on a weak wind day on the sunny side
otherwise up wind and up towards the sun.
For Gauteng area, wind is predominant NW, sun also in afternoon is
shining from the NW, so look for the lift in the NW corner of a cloud.
The source java jar Source code
that was used to make the html tables for speed to fly in different wind
speeds and sink rates.
The Best Glide Java Applet source Java
jar file
Want to know more, then have a look at
http://www.expandingknowledge.com/Jerome/PG/Link/All.htm
or
http://home.att.net/~jdburch/polar.htm
A MS Powerpoint Presentation on this subject
The Applet code got integrated into the T3D2 Thermal Track terrain Data Displayer http://sourceforge.net/projects/t3d2