T3D2 - Terrain Track Thermal Data Displayer -Some Screen Shots
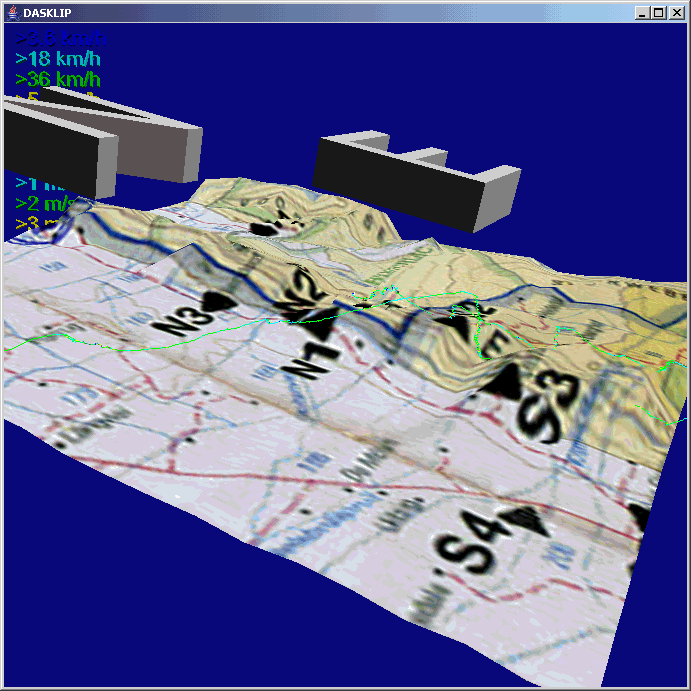
The Terrain can be displayed with color coded altitude, or with
an overlaid scanned map.
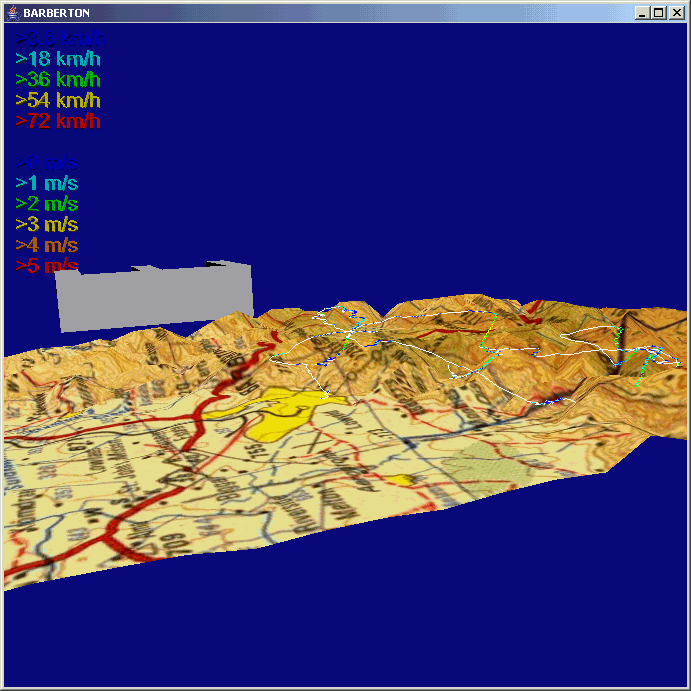
The tracks show area of lift, or uniterrupted lift, as a white line.
The big grey blocks are North and East to give some idea which
direction
is where.
Dasklip - Porterville South Africa
Looking at Dasklip with a flight track courtesy of Andrew Smith.
THE DAM - South Africa
THE DAM - With a scanned ICAO Map jpeg file texture applied
Filght Data provided by Andrew Smith

The Dam in wireframe

THE DAM in Alitude Color Mode
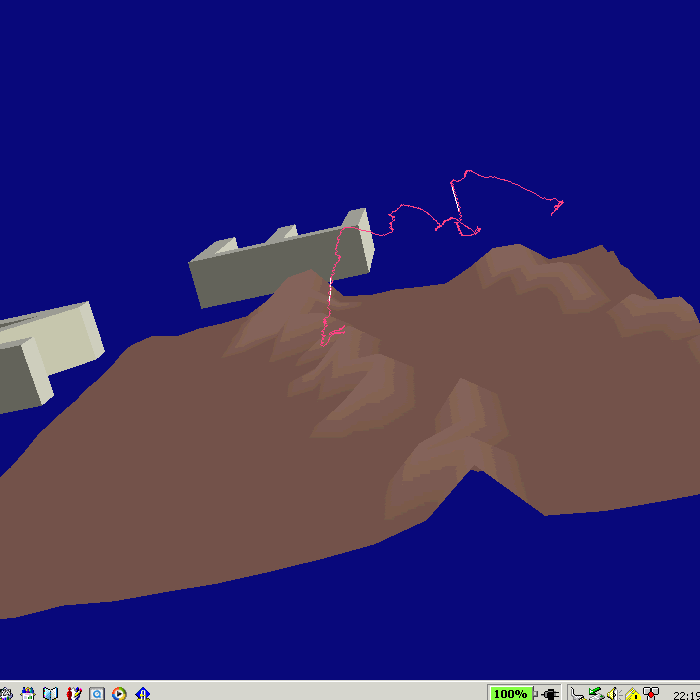
Rauschberg - Europe
Data provided by Ruediger Bien.
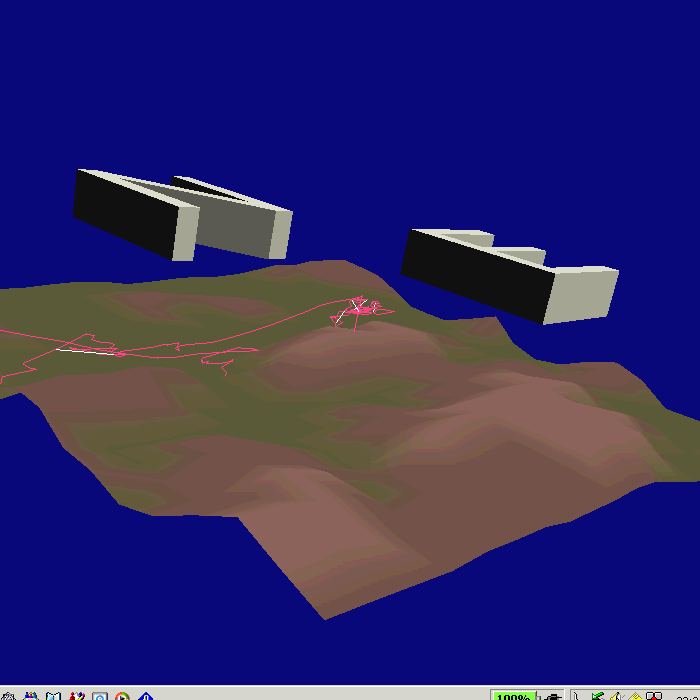

Greifenburg - Europe
Data provided by Ruediger Bien.
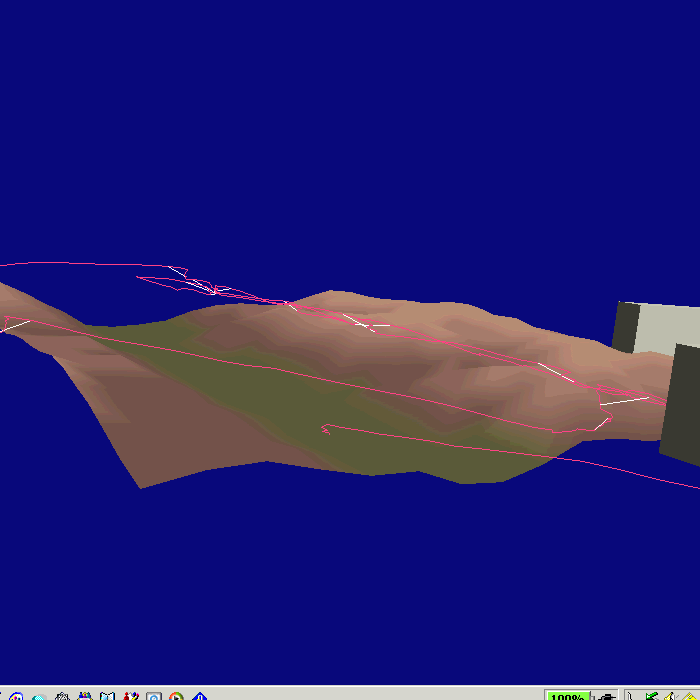

Barberton - South Africa
Flight provided by Nevil Hullet.
Showing Lift instead of Speed color coded track.
Showing all the thermals for all the flights collected for Barberton.
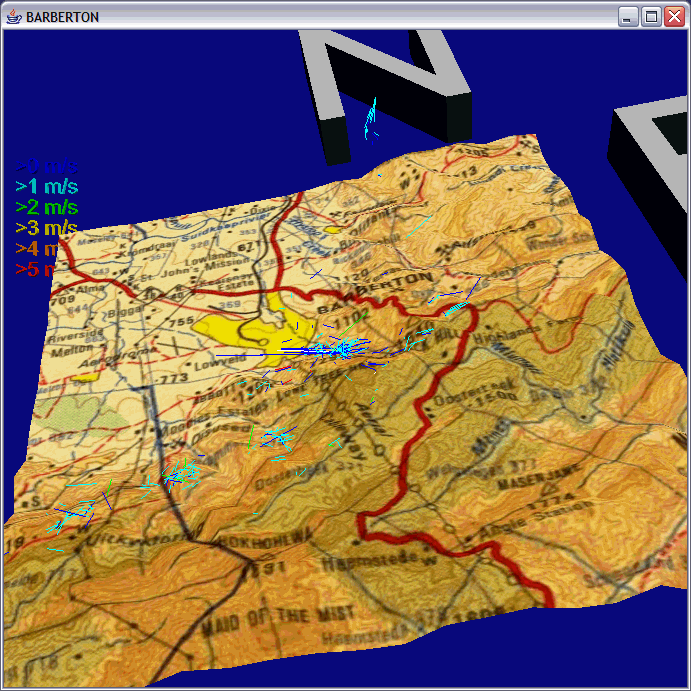
The green ones got collected on a different time. Most flights were
done during the SA 2004 PG Nationals in weak conditions, 0-1 m/s.
One can see the triggerpoints , house thermals, as accumulation of
color lines in certain areas.
Pilots can use this info to plan your XC flying for this site
. The thermal info is available as GPS waypoints to be
downloaded into your GPS.
Welkom, South Africa, 109 km
109 km flight from Welkom.
Using Landsat satellite data.
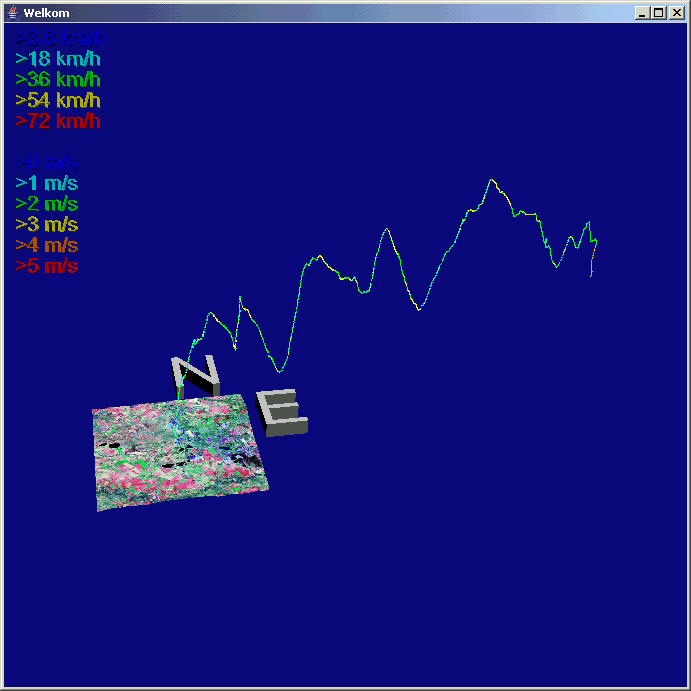
Track Display with Points activated. One can analyze individual
trackpoints
by picking on them.

Speed 2 Fly and Best Glide Track Analysis
A flight from Dunnottar. One can max get 700 meters above take off to
avoid
the TMA above the winchpark.

Using Polar Data of a wing, the code checks, if the pilot flew
optimal
Green means the pilot flew around optimal.
Blue is too fast.
Red is too slow
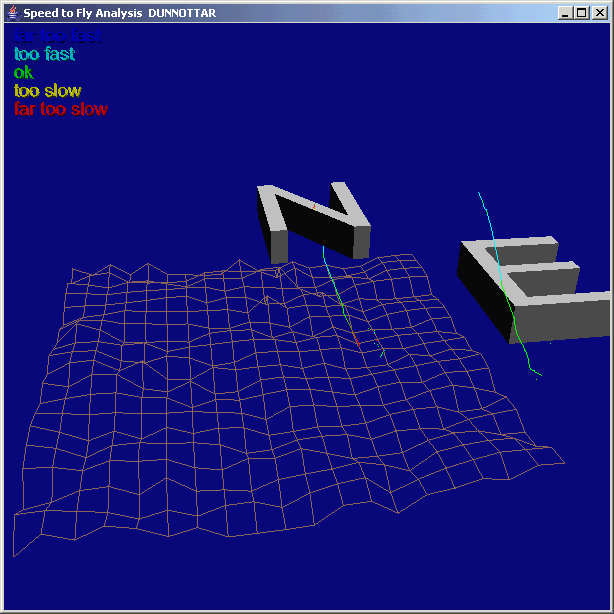
Blue means the pilot flew too fast. Red means too slow for flying
optimal.
And a Best Glide Analysis

Bot much difference between a Speed 2 Fly and a Best Glide.
This Speed to Fly Analysis of the Barberton flight shows
mostly
green.
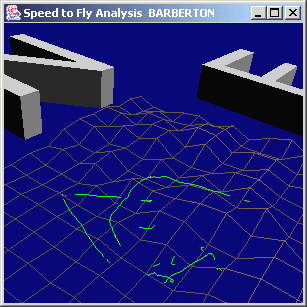
Pilot flew quite good . Pilot uses a Speed 2 Fly GPS Vario combination.
While the Best Glide shows blue areas in his track.

Blue means too fast for Best Glide, what one does when you fly faster
to get into the next lift.
Polar Calculator
The code includes an interactive Polar calculator.
Which allows you to compare 2 wings glide performances
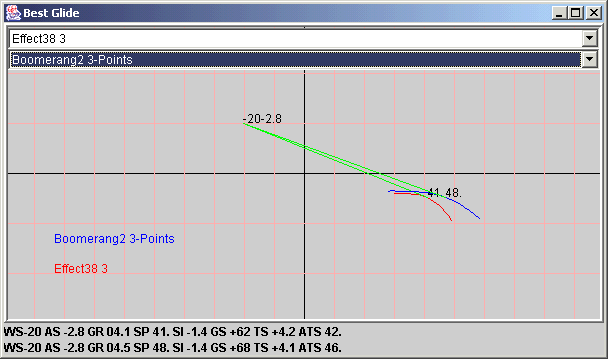
WS = Wind Speed
AS = Air Sink , or expected Lift of next Thermal
GR = Glide Ratio
SP = Indicated Air Speed = Speed where tangent touches Polar
SI = Polar Sink , sink in calm air
GS = Ground Speed, what the GPS would show you
TS = Total Sink = AS + SI, ( the code does rounding up )
ATS = Average Travel Speed , how fast you would go as you thermal and
glide
Turn Polar Calculator
Besides a Best Glide Calculator the code also offers a Best Turn
Calculator
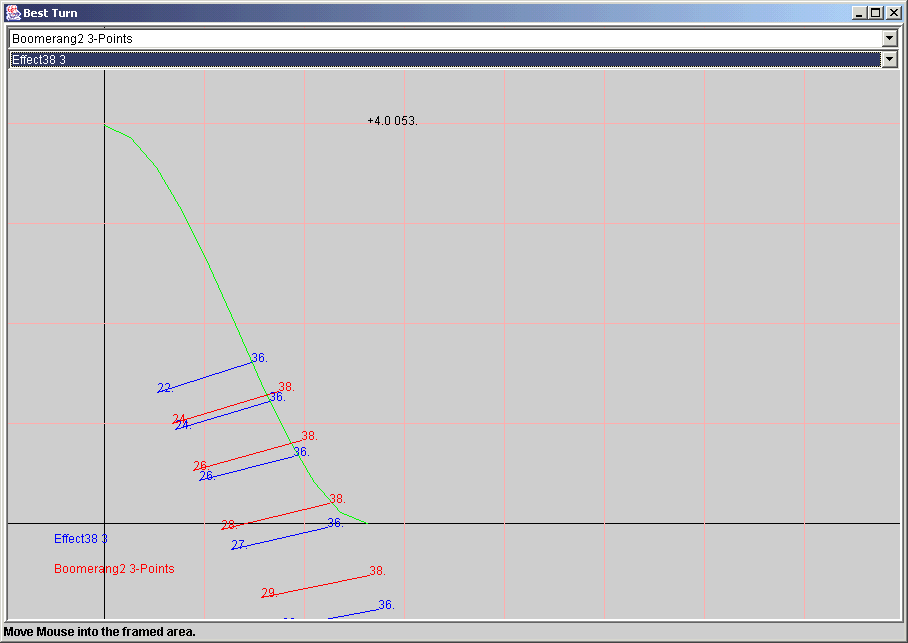
One can use it to determine how to turn your wing optimal in a Thermal.
And under what conditions is one wing better than another wing in
outclimbing
one another in a thermal.
Shows a cross section through half a thermal, maximum lift in this
example
4m/s
And the radius of the thermal is 53m, 0 lift 53 meters away from the
core.
Best way turn the wing would be for the blue glider 22km/h inside and
36 km/h on the outside tip
Animation
Shows a moving cone follwoing the track

And shows the Pilot View , what the pilot would see

Auto Terrain from a Track
Creates from the minimum and maximum coordinates of a track log the
grid
terrain data and then defines a site called Auto.
Thermal Analysis
This shows all the thermals of a flight , the climb rate in red and the
turn radius in blue , overlaid

And one can select a specific thermal from that flight
Like Thermal 7 for example

Above are South Africa Thermals in a mountain area
While below is a European Thermal from Alpine Greifenburg

One seems to turn much wider in Greifenburg compared to Barberton


